BCG Matrix
BCG matrix is developed by Bruce Henderson of the Boston consulting group in the beginning of 1970's. In this method, businesses or products are categorised as low or high performers depending upon their market growth rate and relative market share. The Boston Consulting Group established a tool, called the BCG matrix, to categorize a firm's products in relation to the overall product life cycle. Product life cycle is based on the observation that products develop, similar to animals, through distinct phases of maturity that differ in amount of resources required and produced. The BCG matrix places each product a company offers according to the growth rate of the business and the relative market share the product controls. The main objective of the BCG Matrix is to decide investment priorities for a company with a portfolio of products/BUs. BCG matrix is used to assess Profiles of products/businesses, the cash demands of products, the development cycles of products and Resource allocation and divestment decisions.
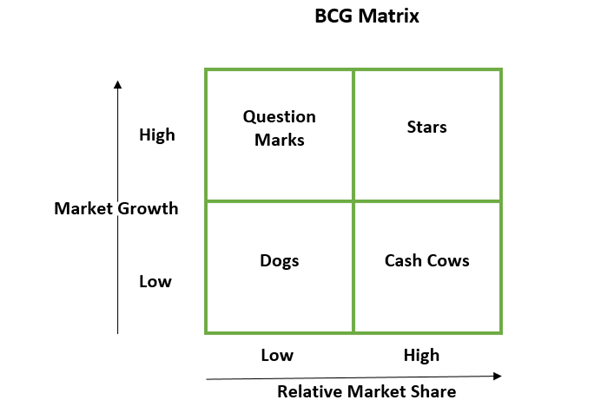
Firms can use this 2 x 2 matrix as an investigative tool in portfolio analysis, strategic management, product management, and brand marketing. The BCG Matrix plots business units or product offerings along two axis, the first is market growth, and the second is market share.
Structure of BCG Matrix
Question marks: They do not generate profits unless the company decides to invest resources to maintain and even increase the market share (become potential stars). They have a high demand for liquidity and the company must ask the question: Invest or give up the product?
Stars: These are favourable products for the company, they even can be considered as leaders of the industry. The strategy is to boost these products by appropriate investments to monitor the growth and maintain a position of strength. These products require a large amount of cash but also contribute to the company's profitability. They are becoming progressively 'cash cows' with market saturation.
Cash Cows: These are products or services which are mature and which generate interesting profits and cash, but need to be replaced because the future growth will be lower. They must therefore be profitable because they can finance other activities in progress (including 'stars' and 'question marks').
Dogs: These products are positioned in a declining market and highly competitive and that the company wants to get rid of soon as they become too expensive to maintain. The company must minimize the dogs. The company must decide whether it still injects liquidity, otherwise it will eliminate the 'dogs' in the near future.

Benefits of BCG matrix
- BCG matrix is simple and easy to comprehend.
- It helps user to quickly and simply screen the opportunities open to him, and helps to think about how he can make the most of them.
- It is used to identify how corporate cash resources can best be used to maximize a company's future growth and profitability.
Limitations of BCG Matrix
The BCG Matrix produces a structure for allocating resources among different business units and makes it possible to compare many business units at a glance. But BCG Matrix has many drawbacks;
- BCG matrix categorises businesses as low and high, but generally businesses can be medium also. Thus, the true nature of business may not be reflected.
- High market share does not always leads to high profits. There are high costs also involved with high market share.
- Growth rate and relative market share are not the only indicators of profitability. This model ignores and overlooks other indicators of profitability.
- BCG MATRIX uses only two dimensions, Relative market share and market growth rate.
- Problems of getting data on market share and market growth.

